WASHINGTON – U.S. Transportation Secretary Anthony Foxx announced today nearly $500 million will be made available for transportation projects across the country in the eighth round of the highly successful and competitive Transportation Investment Generating Economic Recovery (TIGER) grant program. Secretary Foxx was joined by Jeff Zients, Director of the National Economic Council at the White House, and Mayor William Peduto of Pittsburgh, PA on a national call with reporters to highlight how this funding will improve safety and economic opportunity in two U.S. territories, 32 states, and 40 communities across the country. "For the eighth year running, TIGER will inject critical infrastructure dollars into communities across the country," said Secretary Foxx. "This unique program rewards innovative thinking and collaborative solutions to difficult and sometimes dangerous transportation problems. A great TIGER program doesn't just improve transportation; it expands economic opportunity and transforms a community." The highly competitive TIGER grant program supports innovative projects, including multi-modal and multi-jurisdictional projects, which are difficult to fund through traditional federal programs. This year's awards focus on capital projects that generate economic development and improve access to reliable, safe and affordable transportation for communities, both urban and rural. Since 2009, the TIGER grant program has provided a combined $5.1 billion to 421 projects in all 50 states, the District of Columbia, Puerto Rico, Guam, the Virgin Islands, and tribal communities. These federal funds leverage money from private sector partners, states, local governments, metropolitan planning organizations and transit agencies. The 2016 TIGER round alone is leveraging nearly $500 million in federal investment to support $1.74 billion in overall transportation investments. Demand for the 2016 TIGER grant program continued to far exceed available funds; the DOT received 585 eligible applications from all 50 States, and several U.S. territories, tribal communities, cities, and towns throughout the United States, collectively requesting over $9.3 billion in funding. During the previous seven rounds, the Department received more than 7,300 applications requesting more than $143 billion for transportation projects across the country. A few examples of this year's TIGER awards include:
Notably, of the 40 grant recipients this year, nearly two-thirds are repeat applicants. The U.S. Department of Transportation has made a concerted effort to provide technical assistance to applicants to improve their projects. TIGER funding is provided in the FY 2016 Consolidated Appropriations Act, signed by President Obama on December 18, 2015. The Act does not provide dedicated funding for the planning, preparation, or design of capital projects; however, these activities may be eligible to the extent that they are part of an overall construction project. A minimum of 20 percent of funds will go to projects in rural areas.
| |||||||||||||||||
U.S. Transportation Secretary Foxx Announces TIGER Awards Nearly $500 Million in Grants to Projects Focused on Safety and Economic Opportunity


BTS Statistics Release: May 2016 North American Freight Numbers
BTS 40-16
BTS Statistics Release: May 2016 North American Freight Numbers Trucks carried more U.S. freight by value with North American Free Trade Agreement (NAFTA) partners Canada and Mexico in May 2016 compared to May 2015 but declines in all other freight modes led to a 3.1 percent decrease to $89.8 billion in the total current dollar value of cross-border freight. May was the 17th consecutive month that the total value of U.S.-NAFTA freight declined from the same month of the previous year, according to the TransBorder Freight Data released today by the U.S. Department of Transportation's Bureau of Transportation Statistics (BTS). Freight by Mode The value of commodities moving by truck increased 1.3 percent as the value of incoming freight from Mexico (up 6.2 percent) and Canada (up 11.4 percent) exceeded the 5.5 percent decrease in shipments from the U.S. Of the top 10 commodities transported between the U.S. and other NAFTA countries by truck, fruits and nuts had the highest year over year increase – 13.2 percent. The value of freight carried on other modes declined: rail 3.1 percent; air 3.8 percent; pipeline 21.4 percent; and vessel 30.7 percent. A drop in the price of crude oil played a key role in the large declines in the dollar value of products shipped by vessel and pipeline. Crude oil (a component of mineral fuels) comprises a large share of the commodities carried by these modes. Average monthly prices for crude petroleum and refined fuel are available from the U.S. Energy Information Administration. Trucks carried 66.0 percent of U.S.-NAFTA freight and continued to be the most heavily utilized mode for moving goods to and from both U.S.-NAFTA partners. Trucks accounted for $31.2 billion of the $47.9 billion of imports (65.3 percent) and $28.1 billion of the $42.0 billion of exports (66.9 percent). Rail remained the second largest mode by value, moving 15.8 percent of all U.S.-NAFTA freight, followed by vessel, 5.4 percent; pipeline, 3.9 percent; and air, 3.7 percent. The surface transportation modes of truck, rail and pipeline carried 85.8 percent of the total value of U.S.-NAFTA freight flows. U.S.-Canada Freight From May 2015 to May 2016, the value of U.S.-Canada freight flows fell 6.0 percent to $46.0 billion as all modes of transportation except truck carried a lower value of U.S.-Canada freight than a year earlier. Lower crude oil prices contributed to a year-over-year decrease in the value of freight moved between the U.S. and Canada. Crude oil is a large share of freight carried by pipeline and vessel, which were down 22.3 percent and 47.3 percent respectively year-over-year. Trucks carried 61.1 percent of the value of the freight to and from Canada. Rail carried 16.6 percent followed by pipeline, 7.0 percent; air, 4.6 percent; and vessel, 3.4 percent. The surface transportation modes of truck, rail and pipeline carried 84.8 percent of the value of total U.S.-Canada freight flows. U.S.-Mexico Freight From May 2015 to May 2016, the value of U.S.-Mexico freight rose 0.1 percent to $43.9 billion as all modes of transportation except truck and rail carried a lower value of U.S.-Mexico freight than a year earlier. Freight carried by truck and rail both increased 2.3 percent. Air freight value declined 5.3 percent. Pipeline and vessel freight value dropped by 9.6 percent and 18.8 percent respectively, both due mainly to lower crude oil prices. Trucks carried 71.2 percent of the value of freight to and from Mexico. Rail carried 15.0 percent followed by vessel, 7.6 percent; air, 2.8 percent; and pipeline, 0.7 percent. The surface transportation modes of truck, rail and pipeline carried 86.9 percent of the value of total U.S.-Mexico freight flows. See BTS Transborder Statistics Release for summary tables and additional data. See North American Transborder Freight Data on the BTS website for additional data for surface modes since 1995 and all modes since 2004.
You are subscribed to DOT News for Department of Transportation. This information has recently been updated, and is now available.
| |||||||||||||||||

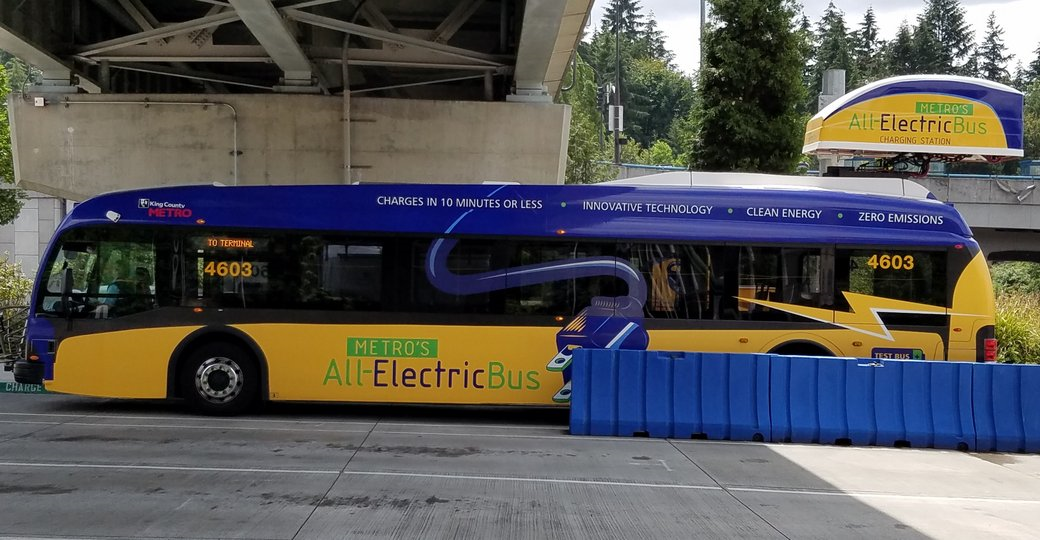
Clean, State-of-the-Technology Buses to Hit the Streets
At the Federal Transit Administration, we're always looking for ways to encourage innovation in transit. New technologies are not just the latest shiny new toys; when tested and demonstrated properly, they can help solve critical issues facing our communities, our nation, and even the world. Our years of work researching low or no-emission buses have paid off, providing the basis for FTA this year to oversee an annual grants program with dedicated funding for new technology buses, the Low or No-Emission (Low-No) Bus Competitive Grant Program.
Click Here to continue reading Clean, State-of-the-Technology Buses to Hit the Streets
| |||||||||||||||||
BTS Statistics Release: 1st-Quarter 2016 Air Fare Data
BTS 39-16 Tuesday, July 26, 2016 Contact: Nancy Wilochka Tel: 202-366-5128 Email: nancy.wilochka@dot.gov
BTS Statistics Release: 1st-Quarter 2016 Air Fare Data
The average domestic air fare decreased to $361 in the first quarter of 2016, down 7.8 percent from $392 in the first quarter of 2015, falling to the lowest level since 2010, adjusted for inflation, the U.S. Department of Transportation's Bureau of Transportation Statistics (BTS) reported today.
BTS reports average fares based on domestic itinerary fares. Itinerary fares consist of round-trip fares, unless the customer does not purchase a return trip. In that case, the one-way fare is included. One-way trips accounted for 33 percent of fares calculated for the first quarter of 2016. Fares are based on the total ticket value, which consists of the price charged by the airlines plus any additional taxes and fees levied by an outside entity at the time of purchase. Fares include only the price paid at the time of the ticket purchase and do not include fees for optional services, such as baggage fees. Averages do not include frequent-flyer or "zero fares." Constant 2016 dollars are used for inflation adjustment.
Inflation-Adjusted Air Fares First-quarter fares rose 7.9 percent from the recession-affected low of $351 in 2009 to the first quarter of 2011. Since 2011, first-quarter fares fell 4.7 percent to 2016.
The first-quarter 2016 fare was down 24.6 percent from the average fare of $479 in 1999, the highest inflation-adjusted first quarter average fare in the 21 years since BTS began collecting air fare records in 1995. Since 1995, inflation-adjusted fares declined 22.7 percent compared to a 57.3 percent increase in overall consumer prices. See BTS Air Fare web page for historic data.
In recent years, airlines have obtained additional revenue from fees charged to passengers as well as from other sources. U.S. passenger airlines collected 73.8 percent of their total revenue from passenger fares during the first quarter of 2016, down from 87.6 percent in 1995.
Quarter-to-Quarter Change Average fares have declined for five consecutive quarters after reaching an inflation-adjusted recent high of $398 in the fourth-quarter of 2014.
Unadjusted Air Fares The $361 first-quarter 2016 average fare was down 7.0 percent from the first quarter 2015 of $388, which was the highest average fare for any first quarter since 1995. Since 1995, unadjusted fares rose 21.7 percent compared to a 57.3 percent increase in overall consumer prices.
First-quarter 2016 fares were down 0.4 percent from the fourth quarter of 2015, dropping to the lowest unadjusted level since the third quarter of 2011 when the average fare was also $361.
First-quarter 2016 fares were down 8.9 percent from the all-time unadjusted quarterly high of $396 in the third quarter of 2014.
See BTS Air Fare Release for summary tables and additional data. See BTS Air Fare web page for historical data.
###
You are subscribed to DOT News for Department of Transportation. This information has recently been updated, and is now available.
| |||||||||||||||||
26th Anniversary of the Americans with Disabilities Act
Posted by Bryna Helfer, Deputy Assistant Secretary for Public Engagement and Senior Advisor for Accessibility and Workforce Development
Twenty-six years ago today, President George H.W. Bush signed into the law the Americans with Disabilities Act (ADA). This landmark civil rights legislation prohibits discrimination and guarantees equal access to opportunity for persons with disabilities.
Click here to continue reading 26th Anniversary of the Americans with Disabilities Act
| |||||||||||||||||
